AVDENS_GF0906 - calculates the average density of gf0906
Author: Torsten Linders
Date: 7 June 2010
Contents
Preparations
Cleaning up
clear
close all
Loading variables from mat-files
load latlon dist_c
load epsi5dm dens
load mycolormap mycolormap
Plotting parameters
casts=size(dens,2);                     %Number of casts, profiler data.
imax=45;                                %Number of columns in transect.
hmax=9e3;                               %Horizontal distance in transect.
hfact=hmax/imax;                        %Metres represented by each column.
jmax=size(dens,1);                      %Number of rows in transect.
dmax=120;                               %Maximum depth in transect.
dfact=dmax/jmax;                        %Metres represented by each row.
Allocations
densAv=zeros(jmax,imax);                %Allocating matrix, mean density.
densAv_count=zeros(jmax,imax);          %Allocating matrix, number of obs.
densAv_v=zeros(jmax,1);                 %Allocating vector, mean density.
densAv_vcount=zeros(jmax,1);            %Allocating vector, number of obs.
f=zeros(1,casts);
Transect
for i=1:casts
    i_m=round(dist_c(i)/hfact);
    if i_m>0
        for j=1:jmax
            if dens(j,i)>0
                densAv(j,i_m)=densAv(j,i_m)+dens(j,i);
                densAv_count(j,i_m)=densAv_count(j,i_m)+1;
            end
        end
    end
end
densAv=densAv./densAv_count;
Profile
for i=1:imax
    for j=1:jmax
        if not(isnan(densAv(j,i)))
            densAv_v(j)=densAv_v(j)+densAv(j,i);
            densAv_vcount(j)=densAv_vcount(j)+1;
        end
    end
end
densAv_v=densAv_v./densAv_vcount;
The array sigma_v
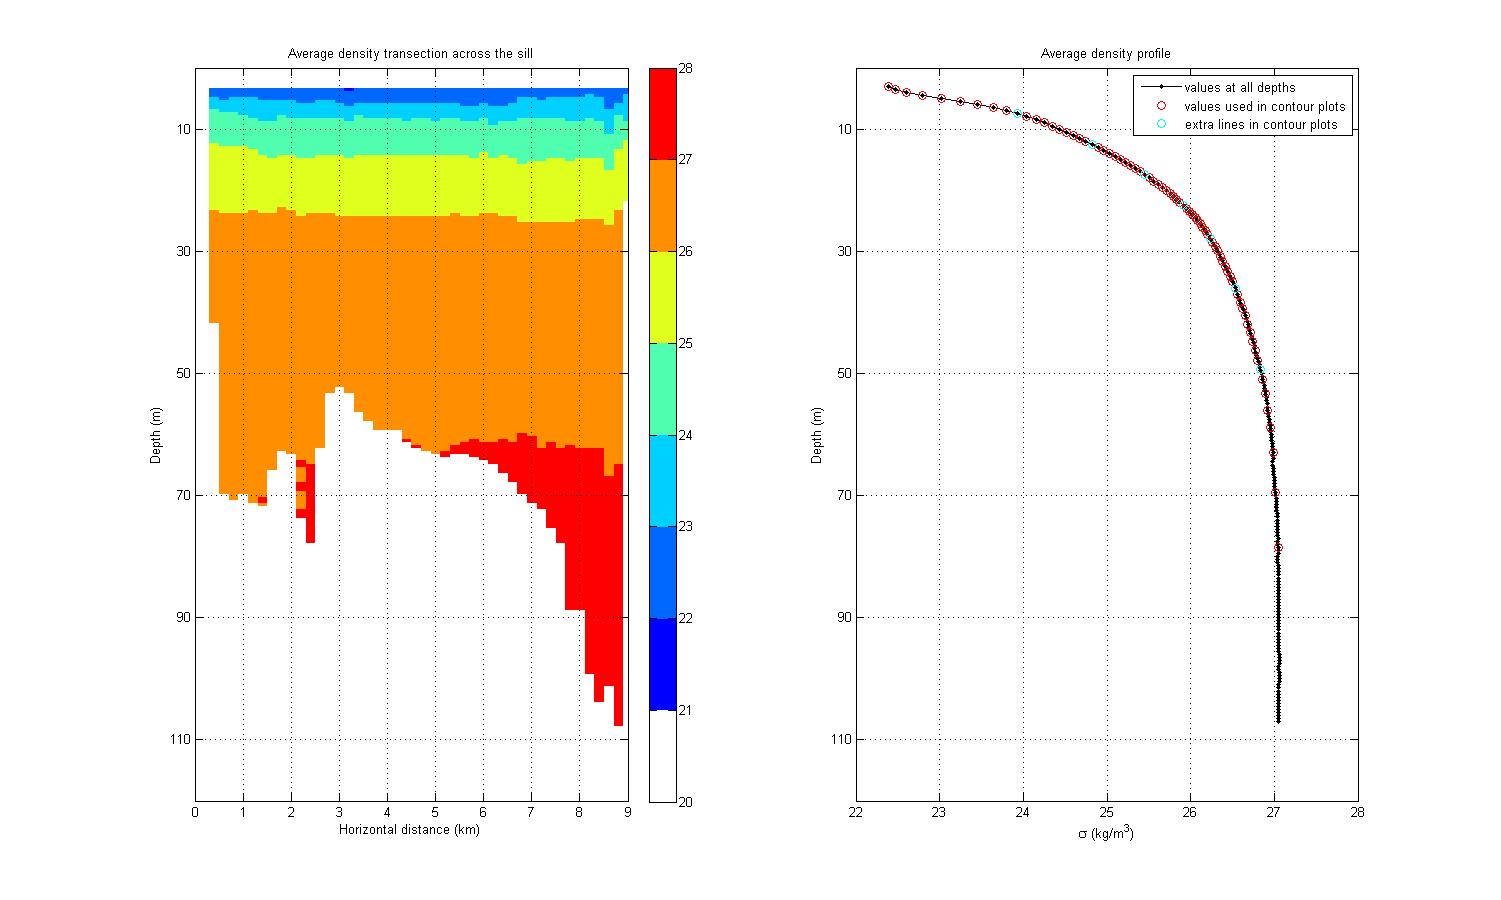
sigma_v contains values for isolines. It is used for the contour plots of density (in legs_gf0906). The purpose of these plots is to show structures in the stratification. sigma_v is therefore constructed with the average profile densAv_v as the base. A minimum resolution is applied in order to not get to many contour lines at large depths. sigma_vs is a an array with fewer values, wich can be used for emphasising some contour lines.
The array sigma_j contains the depth indices of the sigma_v values. It is used in subplot 2 below for indicating the depths of the values of sigma_v. sigma_js contains the depth indices of sigma_vs.
sigma_v=zeros(length(densAv_v),1);
for i=2:length(densAv_v)
    sigma_v(i)=max(sigma_v(i-1)+3.0e-2,densAv_v(i));
end
sigma_v=sigma_v(7:215);                 %Indices without NaN.
sigma_v=sigma_v(1:105);                 %Problem with high indices?!
sigma_vs=sigma_v(10:10:105);
sigma_j=interp1(densAv_v(7:215),7:215,sigma_v);
sigma_js=interp1(densAv_v(7:215),7:215,sigma_vs);
save sigma sigma_v sigma_vs
Plots
fig=figure(1000);
set(fig,'Position',[1 1 1500 900]);
set(fig,'Colormap',mycolormap([1 2:9:end],:));

subplot(1,2,1)
imagesc(densAv)
title('Average density transection across the sill')
caxis([20 28])
grid on
xlim([0 imax])
ylim([0 jmax])
colorbar
xlabel('Horizontal distance (km)')
set(gca,'XTick',0:1000/hfact:imax)
set(gca,'XTickLabel',(0:1000/hfact:imax)*hfact/1000)
ylabel('Depth (m)')
set(gca,'YTick',20:20/dfact:jmax)
set(gca,'YTickLabel',20*dfact:20:jmax*dfact)

subplot(1,2,2)
plot(flipud(densAv_v),1:jmax,'k.-',...
        sigma_v,241-sigma_j,'ro',...
        sigma_vs,241-sigma_js,'co')
legend('values at all depths',...
    'values used in contour plots','extra lines in contour plots')
title('Average density profile')
grid on
ylim([0 jmax])
xlabel('\sigma (kg/m^3)')
ylabel('Depth (m)')
set(gca,'YTick',20:20/dfact:jmax)
set(gca,'YTickLabel',jmax*dfact-10:-20:20*dfact)

Density of observations
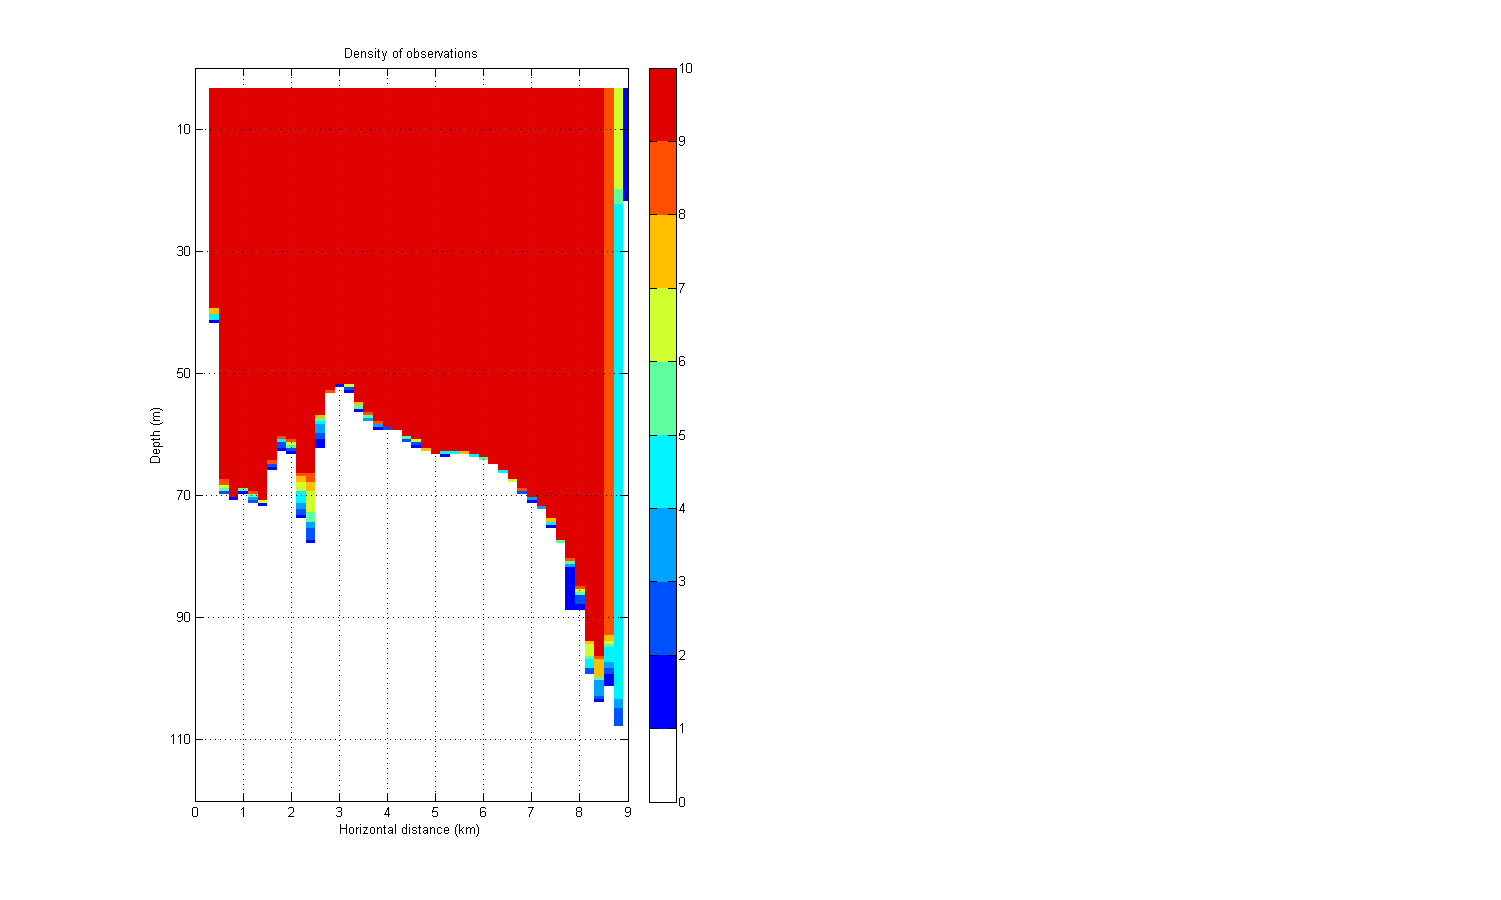
To get a sufficient density of observations in all columns has the horizontal resolution been lowered to hfact=200 m. This governed by the number of columns, imax=45.
if 1
    fig=figure(1001);
    set(fig,'Position',[1 1 1500 900]);
    set(fig,'Colormap',mycolormap([1 2:7:end],:));

    subplot(1,2,1)
    imagesc(densAv_count)
    title('Density of observations')
    caxis([0 10])
    grid on
    xlim([0 imax])
    ylim([0 jmax])
    colorbar
    xlabel('Horizontal distance (km)')
    set(gca,'XTick',0:1000/hfact:imax)
    set(gca,'XTickLabel',(0:1000/hfact:imax)*hfact/1000)
    ylabel('Depth (m)')
    set(gca,'YTick',20:20/dfact:jmax)
    set(gca,'YTickLabel',(20*dfact:20:jmax*dfact))
end
